
Bearish Market Structure: Fair Value Gaps and Order Blocks
5 min Money & business
5 min Money & business
I see. Well, let me ask you what you see before I do it.
What gave me the backdrop for all this in here?
What gave me the realization that this is likely to turn here and go lower?
Study the entire fractal that's being shown, okay?
Pause the video. All right, so we had this high here, we ran above it, and then we had the market shift.
So buy stops taken, breakout artists taken in on the market long, and then relative equal lows broken, so we have a shift in market structure on a five-minute chart.
In a time when it's bearish, we're looking for those relative equal lows to be tagged on the S&P, and this is not the S&P, I understand that, but the expectation is we wanna see these two indices go down on the daily chart.
So heaviness should be the protocol going into our trading day.
In here, we have what? Displacement below these lows, so there's a lot of energy there.
So right above that, what do we have? Fair value gap.
Oh, there's one right here too, right. What did I teach you?
This is where you do your entry. This fair value gap here, we expect that to stab up into it, so our stop has to at least be in a position where it can weather that.
So here is the order flow inside of that fair value gap here.
Again, a little bit of extra runs above into that fair value gap there.
So we had a shift in market structure. We move up into a fair value gap here, and we have a break lower, fair value gap here, relative equal lows.
Now, look real close, folks, okay? Relative equal lows, a high being taken here.
We break down. These two candles move right below here.
That's the same thing as these two candles here being broken with this move here.
It's a fractal. This whole move here is the same thing here, just smaller, and it creates the same thing, the fair value gap here.
The market trades up into it. The body's kind of ex- you know, respecting that little area.
Moves a little bit above it, that's fine, but then breaks aggressively lower.
Does it take out the low yet? No. Retraces up in.
Now, I have two narratives in play. This one here, where we have a shift in market structure there.
So this is a long-term high. Here we have another break lower, it went in balance, so it's an intermediate term high.
This is a bigger one than that one, right?
So this is a long-term high, intermediate term high.
By definition, they're both intermediate term highs because they have imbalances, but this one is lower than this one, and this over here is lower than that one.
So this is a turning point, making this, by the hierarchy of swing points in market structure, this is a long-term high.
Intermediate term, intermediate term because of the imbalance, but how they nest together for market structure, long-term, intermediate term.
Now, when this is retracing up, this is gonna be a short-term high inside of a market structure that is really predisposed to go lower because we have long-term and intermediate term above me.
This should respect the underlying order flow and go lower.
That's below here. There's sell stops resting below that.
So as it retraces back up into this up close candle...
What is this up close candle? It's a bearish order block.
All right, so we're gonna drop into a one-minute chart.
We're inside of that blue shaded area on the five-minute chart.
I'm also inside of this green candle here.
That's a bullish order block. So what I'm doing is now I'm gonna calibrate so the market retreats back up into here, into that order block, and I'm, I'm trying to aim...
Once it hits the midpoint of it, I wanna get in around that time, okay?
So I'm entering there on that candle, and then I'm holding in all this, and it drops back down. Now, some of you might look at this and say, "Oh, but this is that order block fair value gap here," and y- what happens if it rallies?
Well, it does a little bit, but what's it subordinate to?
All the things I outlined over here and on the five-minute chart over here with a higher swing high.
So the market structure is bearish. The market rallies up.
It stabs above the order block here, but it's just the wick. See that?
The bulk of the volume and the bodies of the candles are inside that order block. Then the market does what?
It breaks and shows displacement here. Remember what I said about this pattern here?
Relative equal lows, it breaks down, and it goes back to a fair value gap.
Here it is again, relative equal lows, displacement, fair value gap. What does it do?
Go right back up into what? The fair value gap, and, and look closely at the bottom of the bearish order block. See that?
Bam, hits it. I sold three contracts here, I sold two contracts here, and then I entered again here after it did what?
Retraded back up into this bearish order block here.
So it moved down, came back up in, and I'm selling short here.
Then I submitted to the idea of it going down to that level that I drew out on the...
I forgot what the timeframe was now, but we'll draw back out in a second, but here is the exit here.
I bought all six back at thirteen thousand two eighty-five even.
And for those of you that are students of mine for a longer time than just recently, you recognize this as a market maker sell model.
So I was selling in an area where distribution would take place.
End of transcript · 1,007 words
 0:40 Investment Congratulations and a Gift
 1:07 Adani Group Acquisitions After Raids: Claims About NDTV, Ports and Cement
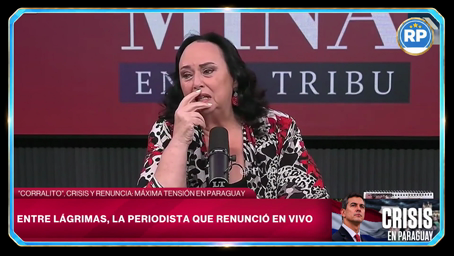 1:33 Mina Felicianelli Says Goodbye on Air After Bueno Bank Intervention
 0:39 Why Do Stock Prices Change? A Critique of the Stock Market
 0:49 Pork Sales at Spinneys: Outsourcing and the Fatwa
 0:36 How a Zlatoust Coffee Shop Changed Its Name from Lav to Oleg
 0:33 Pakistan's Economy: Bankruptcy and Borrowing to Repay Debt
 0:10 Fuel Situation in the Country: A Blunt One-Word Response
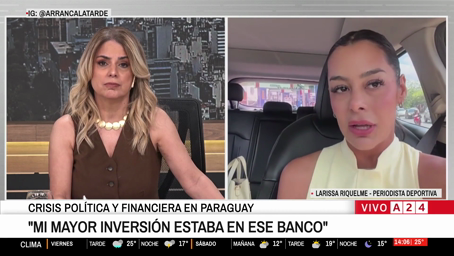 7:08 Buenobanco crisis: Larisa on her savings and BeMedia job suspension
 4:13 Negotiating an Old Stone Sale: From Hundreds to Two Million Yuan
 2:33 Bueno Bank Intervention in Paraguay: Loans and Pension Funds
 3:52 Understanding the Power of Attitude
 iPhone app Translate videos on your iPhone Paste a TikTok, Instagram or X link, add subtitles in your language and save the video to Photos.

TranslateMom transcribes and translates videos from X, TikTok, YouTube and Instagram. Paste a link and you get a page like this one, in your language.