
VWAP Trading Strategies: Standard Deviation Bands and Four Setups
1 min Money & business
1 min Money & business
Forget RSI. Let go of the MACD or any of those laggy indicators.
I'm about to show you the one TradingView indicator that actually tells you where to trade.
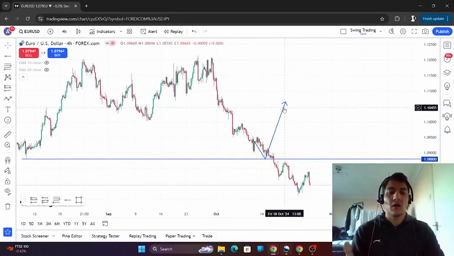
It's the VWAP, or volume-weighted average price.
But not just the VWAP by itself, but VWAP with one standard deviation bands.
This basically turns your chart into a heat map for high-probability trade setups.
Now, here's what to do when price hits one of these levels.
On a trend day, you're going to buy the dips to the upper band.
This is our price discovery continuation setup.
On choppy days, you're going to fade the upper and lower bands just like a sniper.
This is our fade value area extreme setup.
Fake breakout or rejected breakout. Once we return to the value area, we're going to trade this right back to VWAP.
This is our return to value setup. And lastly, what happens when we get a clean pullback mid-trend to the VWAP?
Well, this is the VWAP bounce, baby. Look, these aren't random zones.
This is exactly where professional traders step in, and they work again and again.
Just look back day after day. These setups keep showing up, and we show you these trades we take every single day.
Join our free community. Link in my bio.
End of transcript · 221 words
 7:01 Understanding Liquidity in Trading
 3:45 How Pakistan Border Closures Hurt Kandahar Farmers and Traders
 3:21 The Başaran Family, Habaş and Worker Safety
 3:23 Sock Livestream: Seven-Pair Gift Boxes and Limited-Time Deals
 2:37 How a Stronger Dollar Affects Fuel, Food Oil and Phones in India
 2:01 The 2008 Mortgage Crisis: Foreclosures and the Bank Bailout
 1:57 Unemployment and a Comparison of Working Life in Pakistan
 0:38 Yalda Night Shopping Deals and Surprise Gifts
 1:36 Gabriel Faces Removal from the Company as His Family Worries About Begoña
 1:27 Call to Control Cooking Gas Prices in Tur Al-Baha
 2:04 Yoon Hee-jun’s Viral Moment Boosts Taegang Group Sales
 1:05 Local shopkeeper describes two months of slow business
 iPhone app Translate videos on your iPhone Paste a TikTok, Instagram or X link, add subtitles in your language and save the video to Photos.

TranslateMom transcribes and translates videos from X, TikTok, YouTube and Instagram. Paste a link and you get a page like this one, in your language.