
ICT Silver Bullet: gaps de valor razonable y entradas en corto
10 min Machine translated Money & business
10 min Machine translated Money & business
Voy a enseñarte un poco más sobre los gaps, pero por ahora, aquí está el ICT Silver Bullet de la sesión AM operando hacia ese gap alto. El mínimo del swing está justo ahí. Así que alcanzó nuestro objetivo semanal de un marco temporal superior. Es un nivel clave. Lo alcanza, rompe a la baja, cambio en la
estructura del mercado, eso es bajista. Un pequeño desequilibrio aquí.
Esto de aquí, ese movimiento de ahí, es el modelo de mentoría ICT de 2022.
Así que se toma la liquidez compradora en una prima, cambio en la estructura del mercado, gap de valor razonable, sube hasta él. Ahí está tu venta. Ponte corto.
¿A qué apuntas? Mínimos relativos iguales y liquidez.
Y si quieres pasarte de ambicioso, puedes apuntar al mínimo del gap semanal.
Yo personalmente no lo habría hecho, pero, a efectos del argumento, podrías haberlo hecho.
Ahora, si estás operando el ICT Silver Bullet, tenemos un cambio en la estructura del mercado mucho más pronunciado. Así que este mínimo oscilante se rompe.
Tenemos una brecha de valor razonable entre el máximo de esta vela y el mínimo de aquella.
Esto es un SIBE, desequilibrio del lado vendedor, ineficiencia del lado comprador.
El precio vuelve a subir. Ahí tienes tu corto.
Tendrías que aguantar una vez más y un pequeño retroceso aquí.
Se queda un poco de tiempo y luego finalmente se desploma, rompe una vez más por debajo de ese mínimo, entra en este lado vendedor, pero fíjate en que ese mínimo está apenas por debajo de esos. Sabes lo que está buscando,
el gap de apertura de nueva semana. Son como un imán, ¿de acuerdo? El mercado cae y vuelve a subir, otra brecha de valor razonable. Podrías haber tomado esta si no tomaste aquella, o podrías He operado esta en corto, añadí más aquí. Baja.
Mira dónde está ese mínimo en esa vela justo ahí.
Ese es el mínimo del gap de apertura de la nueva semana. ¡Bum! Perfecto. Justo al tick.
Vuelve a subir de inmediato. Regresando al antiguo gap de valor justo, bajando agresivamente. Hay un pequeño gap aquí, cerca del gap de apertura de nueva semana semanal.
Cotiza al alza hasta entrar en él aquí, lo que es un modelo de entrada de flujo de órdenes institucional, que es un retorno parcial hacia él, no un cierre completo de ese gap.
El máximo de esa vela, el mínimo de esa vela, apenas un poco por encima del mínimo, y luego consolida, se acelera y baja más.
Y te diré por qué ese mínimo sería significativo.
Si tomas el máximo aquí y le añades tu fib aquí y lo trazas hasta ese mínimo, una desviación estándar sería 42 78 coma setenta y cinco. Es un objetivo bastante atractivo si consideramos ese máximo hasta ese mínimo, siendo este mínimo un punto de apoyo.
Eso significa que si este movimiento desde el máximo hasta ese mínimo fuera como una puerta, de acuerdo, y se abriera, este sería la bisagra de la puerta.
Este máximo, si pudiera girar completamente en toda su trayectoria y bajara justo por debajo de ese mínimo aquí, llegaría a ese precio aquí. Así que lo único que digo es que este rango desde ese mínimo hasta el máximo restado de ese mínimo nos lleva justo a este 4278,7 cinco. Ahora voy a enseñarte la teoría avanzada de las brechas.
Vamos a echar un vistazo a ese mismo movimiento de precio.
Todo esto es la caída inicial. Este es un movimiento de Judas durante los primeros treinta minutos de negociación.
Así que, a las 9:30 a. m., en la apertura, vemos que el precio sube, se detiene en seco en el máximo del hueco semanal, el máximo del hueco del que les hablé hace semanas.
Tener ese nivel en su gráfico y anticipar que el precio reaccione ahí.
Mínimo de oscilación, lo rompe a la baja, y eso nos da este pequeño hueco justo ahí. Este hueco de aquí es simplemente un hueco de valor razonable. Es un hueco común. Sin embargo, se pueden operar con el contexto que ya les he enseñado. Modelo de 2022, liquidez compradora, nivel de temporalidad superior.
Toma la liquidez compradora, ¿va a por el mínimo a corto plazo? Sí, lo hace.
¿Dejó un hueco? Sí. Entren en corto, con el stop por encima del máximo de esta vela justo ahí. Si les da mucho miedo y no quieren asumir un riesgo mayor, pongan el stop justo aquí arriba y operen con me-menos apalancamiento.
El mercado, eh, rompe a la baja, y tenemos este hueco justo aquí.
Este es un hueco de valor razonable en forma de un SIBE, igual que este, pero esto es un hueco de ruptura. ¿Qué está haciendo? Se está alejando de este importante máximo de marco temporal superior dentro del modelo de mentorías ICT de dos mil veintidós que les enseñé, y se mueve de forma agresiva.
Así que tenemos uno, dos. Dos veces hay un cambio en la estructura del mercado que es bajista.
Este es un hueco de ruptura. Los huecos de ruptura deben, deben tener algún contexto que explique por qué el precio debería verse…
Por ejemplo, este es un hueco de ruptura bajista.
Se está alejando de un nivel del que ya anticiparíamos que sería alguna oportunidad de venta en corto, ¿de acuerdo? Con algún contexto en torno a este nivel, nosotros esperaríamos ver algún tipo de respeto a ese nivel, ¿de acuerdo?
Es el máximo de un gap semanal de un marco temporal superior.
Ya estuvimos allí el lunes, nos rechazó a la baja.
Creamos un máximo de corto plazo antes de él aquí, luego subimos hasta él allí y y luego se llevó ese mínimo allí. Dejó el gap.
Eso en sí mismo es el modelo de 2022. Luego vuelve a romper.
Regresa de nuevo a él aquí. ¿Qué dejó? Mínimos relativamente iguales.
Ahí tienen su punto de apoyo desde el mínimo al máximo.
Puede que hayas perdido la entrada del modelo de 2022 aquí. No hay problema.
El regreso a este gap de aquí. Los gaps de ruptura tienden a dejar una parte del gap sin llenar. Desde el mínimo de esta vela hasta el máximo de esta vela, retrocede por completo hasta este nivel. Así que entre los máximos de estas velas y el mínimo de esa vela,
queda una pequeña parte abierta. Esperaríamos ver eso.
Si esto va a ser un gap, supongamos que entraron en corto aquí y lo ven y obsérvenlo aquí, su stop, si hubieran entrado en corto aquí, estaría por encima de este máximo de la vela, sin temer ningún regreso a esta zona porque hemos tenido dos cambios en la estructura del mercado.
Este regreso aquí, lo anticipan al entrar en esta operación, esperan que esta parte siga abierta.
Si lo hace, de todos modos querrán ver que eso ocurra para su operación.
Pero si no y se llena por completo, entonces no es un gap de ruptura y quizá tenga que volver a subir y tocar esto una vez más.
Así que, si los sacara el stop, tendrían que esperar a que alcance esta brecha de valor razonable y luego romper una vez más, crear otro desequilibrio o una brecha de valor razonable y luego usarla para entrar en corto. Así que lo que acabo de enseñarles es como navegas.
Si te equivocas y no se convierte en una brecha de ruptura, esperas a que cotice hacia la brecha de valor razonable del marco temporal superior y luego vuelva a bajar y cree otra brecha de valor razonable y luego considera eso como una posible brecha de ruptura posterior.
Pero el contexto es que está subiendo aquí para hacer creer a los traders que va a subir.
Alcista, ¿vale? Desde este mínimo hasta este máximo de aquí, esto parece una bandera alcista, te lo garantizo, para la mayoría de los traders minoristas.
Y cuando superó ese máximo aquí, eso validó que todos pensaran que es una bandera alcista, luego bajó. Ahora, si no tuvieras ese máximo de la brecha semanal, tú nunca entenderías lo que te estoy mostrando aquí, pero conoces ese nivel desde hace semanas. Bajó, y aquí dentro hay una brecha de ruptura.
Se considera una brecha de ruptura porque se aleja y baja hasta otro nuevo mínimo y deja esa zona abierta.
En ese momento, tenemos mucha confianza en que nunca volverá a subir hasta este nivel, así que podemos bajar nuestro stop justo a ese nivel. Y dejar que siga.
Entonces tenemos estas dos velas aquí. Son velas de un minuto, así que esto equivale esencialmente a dos minutos de una brecha de valor justo. Esta es una brecha de valor justo estándar y típica de ICT en forma de SIBI, y pueden ver que vuelven y cotizan de nuevo en ellas.
Son, nuevamente, una brecha común. Las brechas comunes pueden volver a cotizarse varias veces y las recuperan a veces como soporte o resistencia.
Y luego tenemos esta gran brecha aquí, estas dos velas con cierre bajista.
Eso es una gran brecha de valor justo en forma de SIBI.
Si estuviéramos viendo un gráfico de dos minutos, ahora mismo es de un minuto.
Si haces esto en tus propios gráficos, observa esta zona aquí en un gráfico de dos minutos Es una vela bajista, así que solo está volviendo a cotizar dentro de la invasión consecuente del rango de dos minutos de estas dos velas específicas de un minuto.
Así que, en términos sencillos, desde el mínimo de esta vela y el máximo de esta vela en un gráfico de dos minutos, esta es una vela bajista de cierre.
Su punto medio es donde cotiza aquí. Eso es invasión consecuente.
Esta es una brecha de valor justo en forma de SIBI, desequilibrio del lado vendedor, ineficiencia del lado comprador , y es una brecha de medición. ¿Qué significa eso?
Podemos tomar este rango y usarlo para proyectar.
El mercado rompe a la baja, y luego tenemos otra brecha de valor justo en forma de SIBI. Puedes ver esto en un gráfico de dos minutos. gráfico.
Esta será una vela bajista de cierre, y de nuevo, esencialmente entrando en la penetración consecuente, tomando la liquidez compradora aquí, y luego rompiendo a la baja hacia un mínimo más bajo por debajo del mínimo de ese hueco semanal. Los huecos estándar de valor razonable, que son huecos comunes,
pueden recuperarse o volver a negociarse como resistencia o soporte.
El mercado vuelve a subir hasta aquí. Miren los cuerpos de las velas aquí.
¿Qué les dice eso? La narrativa, si están leyendo mi teoría de las brechas en el precio, si ven estas señales así, vean aquí, les digo todo el tiempo, los cuerpos les cuentan la historia.
Las mechas hacen el daño. Las mechas son con lo que todos los demás se confunden.
Leer la acción del precio sin indicadores con el tiempo y buscar este tipo de señales aquí, la apertura y el cierre de estas dos velas aquí respaldan la idea de que el mínimo de esa ineficiencia está siendo respetado y entonces, ¿qué hace el precio? Cotiza más bajo. ¿Hacia dónde cotiza?
Por debajo del lado vendedor aquí, pero no a cualquier nivel.
Si tomamos el máximo de ese movimiento de precio y trazamos ese Fibonacci hasta abajo, hasta el máximo de esa vela justo ahí, desde el máximo hasta el mínimo del gap. ¿Por qué este gap? Porque este es el gap de medición.
Es aproximadamente la mitad de un rango de negociación implícito.
Implícito significa que buscamos que vaya más abajo, pero aún no hemos visto al precio ir allí. No estamos reaccionando, recuerden. Estamos prediciendo el precio.
Entonces, el máximo aquí, trácenlo hasta abajo, hasta el máximo de esa vela justo ahí. Lo que eso hace es darles una proyección hacia un estándar desviación negativa de uno. La desviación estándar negativa de uno llega a 4.269,25.
El mínimo llega exactamente a 4.269, 25.
Amigos, ese es el mínimo diario justo ahí, al tick, y nunca bajó más hoy, ni siquiera después de la sesión fuera de horario, no bajó más.
Así que esta es mi teoría de proyección de oscilaciones ICT.
Cuando desgloso el mercado… Miren, las brechas son como una matriz PDRA.
Tienen una jerarquía. Hay una brecha de ruptura.
Hay brechas comunes. Las brechas comunes pueden rellenarse. Eso significa que se negocian varias veces.
Las brechas de medición tienden a dejar una parte abierta, igual que una brecha de ruptura. Así que, si esperamos que baje más, es lógico que esperemos que no se negocie hasta aquí arriba.
Y si esperamos que sea una brecha de medición, ¿adivinen qué?
Queremos ver que no suba hasta ahí y eso confirma y califica como un gap de medición. Luego podemos tomar el máximo y proyectarlo al mínimo del gap si estamos bajistas, y luego obtener nuestras desviaciones estándar.
Pero esa desviación estándar neg- negativa uno tiene que estar de acuerdo con moverse por debajo de una antigua zona de liquidez. Así que es entre estas dos cosas lo que nos da precisión, ¿vale?
No se trata simplemente de tomar un fib, ponerlo sobre dos oscilaciones de precio distintas, y luego obtener las mismas matemáticas que yo tengo.
Sino de entender que los gaps tienen una jerarquía, ¿vale?
Y así es como califico mis gaps. Cada vez que me ven hacer un episodio de trading grabado en el que entro y opero con datos en vivo y voy incrementando posiciones y añadiendo e incrementando posiciones y añadiendo y tomo ganancias parciales y busco un nivel específico, uso esta lógica cuando estoy
trazando, cuando digo: «Quiero dejar esto, ver que esta parte del hueco quede abierta. Quiero ver que esta parte del hueco quede abierta». Lo ideal es que deje esta parte abierta, sin rellenar. Esta es la teoría que te estoy enseñando aquí.
End of transcript · 2,322 words · machine translated
I'm gonna teach you a little bit more about gaps, but for now, here is the AM session ICT Silver Bullet trading up into that gap high. Swing low is right there. So it hit our higher time frame weekly objective. That's a key level. It hits it, breaks lower, shift in market structure, that's bearish. Small little imbalance here.
This right here, that move right there, that is the twenty twenty-two ICT mentorship model.
So buy side taken into a premium, shift in market structure, fair value gap, trades up into it. There's your shell. Go short.
What do you aim for? Relative equal lows and liquidity.
And if you wanna be overzealous, you can aim for the weekly gap low.
I personally wouldn't have, but for the sake of argument, you could have.
Now, if you're trading the ICT Silver Bullet, we have a shift in market structure that's much more pronounced. So this swing low here is broken.
We have a fair value gap between this candle's high and that candle's low.
This is a SIBE, sell-side imbalance, buy-side inefficiency.
Price returns back up. There's your short.
You'd have to endure one more time and a small amount of drawdown in here.
It spends a little bit of time, and then finally gives up the ghost, breaks one more time below that low, digs into this sell side, but notice that that low is just barely below those. You know what it's reaching for, new week opening gap.
They're like a magnet, okay? The market drops, comes back up, another fair value gap. So you could have taken this one if you didn't take that one, or you could have traded this one short, pyramided more in here. Drops down.
Look where that low is on that candle right there.
That's the new week opening gap low. Bang. Perfect. Right to the tick.
Runs right back up in. Returning back to the old fair value gap, dropping aggressive. Small gap in here around new week opening gap.
Trades up into it here, which is institutional order flow entry drill, which is a partial return into, not a complete closure of that gap.
That candle's high, that candle's low, just a little bit above the low, and then consolidates and tears off and goes lower.
And I'm gonna tell you how that low would be significant.
If you take the high here and add your fib to it here and draw it down to that low, one standard deviation would be forty-two seventy-eight point seven five. That's a pretty handsome objective if we treat that high to that low, this low being a fulcrum point.
That means if this move from high to that low was like a door, okay, and it swung, this was the hinge of the door.
This high, if it was allowed to swing completely all the way around and would come right down right below that low here, it would come to that price point here. So all I'm saying is, is this range from that low to high subtracted from that low takes us right to this forty-two seventy-eight point seven
five. Now I'm gonna teach you advanced gap theory.
We're gonna take a look at that same price swing.
All of this is the, the initial runoff. This is a Judas swing in the first thirty minutes of trading.
So at nine thirty opening bell, we see the price run higher, stops dead in its tracks at the weekly gap high, the gap high that I told you about weeks ago. Having that level on your chart and then anticipating price reacting there. Swing low, it breaks lower, and that gives us this small little gap right there. This gap right there
is simply a fair value gap. It's a common gap. They can be traded, though, with the context I've already taught you. Twenty twenty-two model, buy side, higher time frame level.
Takes buy side, does it go after the short-term low? Yes, it does.
Did it leave a gap? Yes, it did. Go short, stop above this candle's high right there. If you're really scared and you don't wanna take a larger risk, put your stop right above here and trade with le-less leverage.
The market, uh, breaks lower, and we have this gap right here.
This is a fair value gap in the form of a SIBE just like this is, but this is a breakaway gap. What is it doing? It's breaking away from this important higher time frame high inside the model of the twenty twenty-two ICT mentorship model that I taught you, and it's moving aggressive.
So we have one, two. Two times there's a shift in market structure that's bearish.
This is a breakaway gap. Breakaway gaps must, it must have some context as to why price should see...
For instance, this is a bearish breakaway gap.
It's breaking away from a level that we would already anticipate being some measure of a short, okay? Some context around this level, we would expect to see some kind of respect of that level, okay?
So it's a higher time frame weekly gap high.
We've already been there on Monday, repelled lower.
We created a short-term high prior to it here, and then ran up to it there, and then it took that low out there. Left the gap.
That in itself is the twenty twenty-two model. Then it breaks again.
Returns back into it here. What did it leave? Relative equal lows.
So there's your fulcrum point from low to high.
You may have missed the twenty twenty-two model entry here. No problem.
The return back into this gap here. Breakaway gaps tend to leave a portion of the gap unfilled. From this candle's low to this candle's high, it retraces all the way up into this level. So between these highs of these candles and that candle's low,
there's a small portion that's left open. We would expect to see that.
If this is gonna be a gap, say you went short into it here and you're seeing it and watch it in here, your stop if you were shorting in here would be above this candle's high, not fearing any return back into this because we have had two shifts in market structure.
This return in here, you're anticipating while entering this trade, you're expecting this portion to stay open.
If it does, you wanna see that happen anyway for your trade.
But if it doesn't and it completely fills it in, that's not a breakaway gap, then it may need to come back up and tap this one more time.
So if you were to get stopped out, you'd have to wait for it to hit this fair value gap and then break one more time, create another imbalance or fair value gap, and then use that to go short. So what I've just taught you is how you navigate.
If you're wrong and it doesn't become a breakaway gap, you wait for it to trade to the higher time frame fair value gap and then break lower again, create another fair value gap, and then treat that as a potential later breakaway gap.
But the context is it's running up here to get traders thinking it's going higher. Bullish, okay? From this low up to this high in here, this looks like a bull flag, I guarantee you, to most retail traders.
And when it went above that high here, that validated everyone thinking that it's a bull flag, then it broke lower. Now, if you didn't have that weekly gap high, you would never understand what I'm showing you here, but you've known that level for weeks. It broke down, and in here is a breakaway gap.
It's qualified as a breakaway gap because it leaves and goes lower to another lo- new low and leaves that portion open.
At that time, we get real confident that it never will come back up to this level here, so we can drop our stop right to that level there. And-Let it roll.
Then we have these two candles here. These are one-minute candles, so this is essentially two minutes of a fair value gap. So this is a standard, typical ICT fair value gap in the form of a SIBI, and you can see them come back and trade back to them.
They're like, again, a common gap. Common gaps can be re-traded to multiple times, and they reclaim them sometimes as support or resistance.
And then we have this large gap here, these two down close candles.
That's one big fair value gap in the form of a SIBI.
If we were looking at a two-minute chart, right now it's one minute.
If you do this on your own charts, look at this area here on a two-minute chart.
That's one candle down, so it's only trading back up into consequent encroachment of the two-minute range of these two specific one-minute candles.
So in easy language, in layman's terms, from this candle's low and this candle's high on a two-minute chart, this is one down close candle.
Midpoint of that is where it's trading here. That's consequent encroachment.
This is a fair value gap in the form of a SIBI, sell side imbalance, buy side inefficiency, and it's a measuring gap. What does that mean?
We can take this range and use it for projection.
The market breaks lower, and then we have another fair value gap in the form of a SIBI. You can look at this on a two-minute chart.
This will be one down close candle, and again, essentially working into consequent encroachment, taking buy side here, and then breaking lower to a lower low below that weekly gap low. Standard fair value gaps, which are common gaps,
they can be reclaimed or traded back to as resistance or support.
Market trades back up to here. Look at the bodies of the candles here.
That's telling you what? The narrative, if you're reading my gap theory in price, if you see these signatures like this, see here, I tell you all the time, the bodies tell you the story.
The wicks do the damage. The wicks is what everybody else gets messed up with.
Reading price action naked with time and looking for these types of signatures here, the open and close of these two candles here are supporting the idea that this low of that inefficiency is being respected, and then price does what? It trades lower. Where does it trade to?
Below the sell side here, but not some random level.
If we take the high of that price swing and draw that Fibonacci all the way down to that candle's high right there, from high to low of the gap. Why this gap? Because this is the measuring gap.
It's approximately half of a implied dealing range.
Implied meaning we're looking for it to go lower, but we haven't seen price go there yet. We're not reacting, remember. We're predicting price.
So the high here, draw that down to that candle's high right there. What that does is gives you a projection to a standard deviation of negative one. The negative one standard deviation comes in at forty-two, sixty-nine point two five.
The low comes in exactly at forty-two, sixty-nine point two five.
Folks, that is the daily low to the tick right there, and it never went lower today, even after hour session, didn't go lower.
So this is my ICT swing projection theory.
When I break the market down... See, gaps are just like a PDRA matrix.
They have an hierarchy. You have a breakaway gap.
You have common gaps. Common gaps can be reclaimed. That means traded multiple times.
Measuring gaps tend to leave a portion open, just like a breakaway gap. So if we're expecting it to go lower, it stands to reason that we expect it not to trade all the way up here.
And if we're expecting it to be a measuring gap, guess what?
We wanna see it not go up there, and that confirms and qualifies it as a measuring gap. Then we can take the high, project it down to the low of the gap if we're bearish, and then get our standard deviations.
But that standard deviation neg- negative one has to be in agreement with moving below an old area of liquidity. So that's between these two things makes us have the precision, okay?
It's not simply you take a fib, put it over two different price swings, and then you're gonna get the same math that I have.
But understanding that gaps have an hierarchy, okay?
And this is how I qualify my gaps. Every time you watch me do a recorded trading episode where I'm going in and I'm trading live data and I'm pyramiding and adding and pyramiding and adding and I'm taking partials off and I'm looking for a specific level, I'm using this logic here when I'm drawing out, when I say, "I wanna leave this,
see this portion of the gap stay open. I wanna see this portion of the gap stay open." Ideal if it leaves this portion open, unfilled. It's this theory I'm teaching you right here.
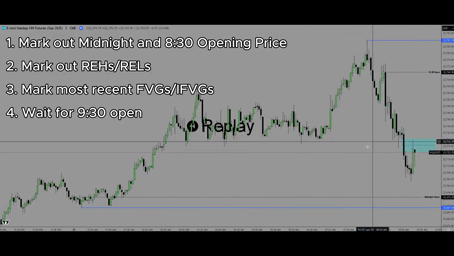 5:23 Estrategia ICT de liquidez y reversión en la apertura de Nueva York a las 9:30
 8:57 Cómo usar la IA para impulsar el crecimiento empresarial
 4:55 Trabajar con inteligencia o duro: la búsqueda de empleo de un guardia de seguridad
 1:29 Beneficios de las farmacéuticas durante la pandemia de COVID-19
 2:44 Debate: ¿Es la economía de EE. UU. la mejor para la movilidad social
 9:01 Cómo monetizar contenido de GTA 6 en YouTube
 1:45 Joven multimillonario en Dubái comparte consejos de negocios e inversión inmobiliaria
 1:03 Entrevista de trabajo donde todas las respuestas son sobre dinero
 2:19 Correcciones del mercado: cómo aprovechar las caídas de las acciones
 1:22 Sucesión del CEO, control de las empresas y gestión responsable
 1:14 Acusaciones sobre BlackRock, Vanguard y la tokenización financiera
 1:50 La deuda argentina bajo Milei: devaluación del peso e inflación
 iPhone app Translate videos on your iPhone Paste a TikTok, Instagram or X link, add subtitles in your language and save the video to Photos.

TranslateMom transcribes and translates videos from X, TikTok, YouTube and Instagram. Paste a link and you get a page like this one, in your language.