
سيولة الاستدراج: كسر الهيكل بالذيل مقابل جسم الشمعة
2 min Machine translated Money & business
2 min Machine translated Money & business
يظن كثير من المتداولين أنهم يفهمون مفهوم السيولة الاستدراجية لكن في الواقع، أنتم لا تفهمونه.
تعرفون حين يأتي الناس ويرسمون هذا النمط، صحيح؟
يقولون: «أوه، حصل لدينا كسر للهيكل هنا، ثم حصل لدينا كسر آخر للهيكل هنا، ثم يصبح هذا الشخص الآن نقطة استدراج يأتي السعر إليها ويزيلها، ثم يكسر الهيكل، صحيح؟ إذًا يصبح هذا الشخص هنا نقطة استدراج.
يعرف متداولون كثر النمط، لكن حين يتعلق الأمر بتحديده على الرسوم البيانية بالضبط كما ينبغي، فهنا تكمن المشكلة.
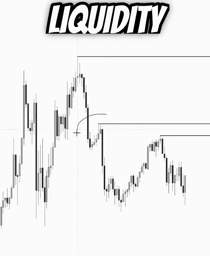
والآن، هذا ما أعنيه. عندما تنظرون إلى هذا الرسم البياني، يمكنكم أن تروا أن الهيكل هابط بوضوح، صحيح؟
حصل لدينا كسر للهيكل هنا، وحصل لدينا كسر آخر للهيكل هنا، وحصل لدينا كسر آخر للهيكل هنا، ومن المفترض أن يكون لدينا هنا كسر نهائي للهيكل.
لكن حين تنظر عن كثب، أيمكنك رؤية ما حدث؟
يمكنك أن ترى بوضوح أن هذا الشخص هنا أغلق بجسم الشمعة، وهذا الشخص هنا أغلق بجسم الشمعة، وهذا الشخص هنا أغلق بجسم الشمعة، لكن هذا الشخص هنا أغلق بفتيل الشمعة.
والآن، عندما يعجز الأصل أو كتلة أخرى، أيًّا كان الموجود هنا، عن إغلاق السعر بجسم الشمعة، تصبح تلك النقطة حافزًا للنقاط السابقة التي تسببت في كسر الهيكل بجسم الشمعة.
إذًا، هذا ما أعنيه أساسًا. ستبدو نقطة دخولك على هذا النوع من المخططات على هذا النحو تقريبًا، حيث تكون هذه النقطة حافزًا.
لذا ستتوقع أنه في المرة القادمة التي يعود فيها السعر إلى هنا، سيخترق هذه النقطة.
هذه النقطة غير محمية، لأنها لم تُغلق بشمعة كاملة.
لذا، حين ترى السعر، يمكنك أن ترى كيف أزاح السعر هذه النقطة، وستتوقع منه أن يحترم هذه النقطة، ثم يهبط في النهاية ليُزيل هذا القاع باعتباره هدف السيولة.
وكما ترى، هكذا، يمكنك أن ترى كيف… حسنًا، لم يُزلها بعد.
لذا يمكنك أن ترى كيف أزالها في النهاية…
يمكنك أن ترى كيف أزالها في النهاية، صحيح، بعد أن استخدمها كإغراء لهذه الكتلة الأخرى.
وهكذا تعمل سيولة الإغراء.
End of transcript · 301 words · machine translated
A lot of traders think they understand the concept of inducement liquidity, but in reality, you don't.
You know when people come and draw this pattern, right?
They say, "Oh, we had a break of structure here, then we had another break of structure here, and then this guy now becomes an inducement where price comes, takes it out, and breaks structure," right? So this guy here becomes an inducement.
A lot of traders know this pattern, but when it comes to identifying it in the charts exactly as it should be, that's a problem.
Now, this is what I mean. When you look at this chart, you can see that structure is clearly bearish, right?
We had a break of structure here, we had another break of structure here, we had another break of structure here, and we're supposed to have a final break of structure here.
But when you look closely, can you see what happened, right?
You can clearly see that this guy here closed with a body, this guy here closed with a body, this guy here closed with a body, but this guy here has closed with a wick.
Now, whenever an origin or another block, whatever is here, is not able to close price with a body, that point now becomes an inducement for the previous points that caused the break of structure with the body.
So basically, this is what I mean. Your entry for this type of charts would now look something like this, where this guy is an inducement.
So you'd expect that the next time price comes back up here, it's going to take out this point.
This point is not protected because it did not close with a body.
So when you play price, you can see how price has taken out this point, and you'd expect it to respect this point and eventually go down to take out this low as the draw on liquidity.
And as you can see, like so, you can see how... Okay, it has not taken it out yet.
So you can see how it has eventually...
You can see how it has eventually taken it out, right, after using it as an inducement for this other block.
And that is how inducement liquidity works.
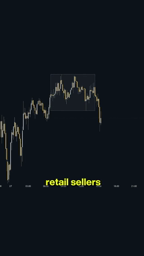
 0:53 اكتساح السيولة الداخلية والخارجية في التداول
 0:52 كيفية تداول نموذج التجميع والتلاعب والتوزيع باستخدام ملف الحجم
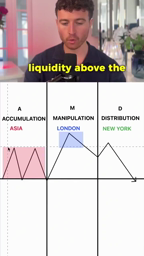 0:49 استراتيجية AMD: التجميع والتلاعب والتوزيع في جلسات التداول
 1:36 دورة AMD في التداول: جلسات آسيا ولندن ونيويورك
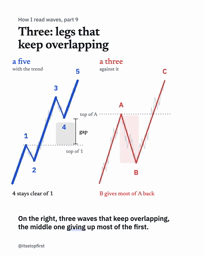 0:56 موجات إليوت: الفرق بين صعود بخمس موجات وارتداد بثلاث
 0:41 كيفية استخدام مستويات منتصف الليل و8:30 و9:30 في التداول
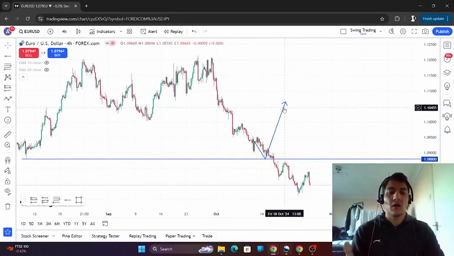 7:01 السيولة في التداول: تحديد الاتجاه اليومي باستخدام قمم وقيعان الأطر الزمنية الكبرى
 4:32 كيفية استخدام سيولة خط الاتجاه في التداول
 9:07 مزاعم عن سيطرة جماعة شيطانية على الحكومات وخطة لظهور المسيح الدجال
 1:15 مشادة بين زبون وموظف متجر حول الحقيبة وفصل الموظف
 1:56 ضباط أفلام الأكشن يتنافسون للقبض على الأشرار مقابل زيادة في الراتب
 2:44 محاكاة ساخرة لبن شابيرو عن الحرب على إيران والإعلام
 iPhone app Translate videos on your iPhone Paste a TikTok, Instagram or X link, add subtitles in your language and save the video to Photos.

TranslateMom transcribes and translates videos from X, TikTok, YouTube and Instagram. Paste a link and you get a page like this one, in your language.