
SPY Short Trade: Volume Price Analysis on the 5-Minute Chart
3 min Money & business
3 min Money & business
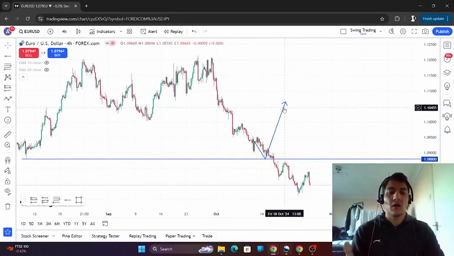
We had a fantastic volume price analysis setup that occurred today on this chart that we're looking at, which is the SPY five-minute.
And before we start, I know somebody's gonna comment something stupid like, "Thanks for telling us about a trade after it happened, buddy." Well, guess what?
I took the fucking trade here. I shorted this due to the setup I'm about to explain.
So hop off my jock, and let's get into it.
Go like and share the video before we do.
All right, so from a VPA perspective, this morning was pretty straightforward.
Little bit of an uptrend, and then news came out at 10:00 a.m. Eastern.
It's 9:00 on my chart because I'm Central Time.
High volume, this thing ran to high of day, everything looked good.
The next one, two, three, four, five candles are the setup that I took, and that is a decent little sell-off here, increasing volume.
We got that high of day rejection. All right, that was nice.
It showed a little bit of strength, but then the key comes when we get this low-volume rally.
Bulls on the lowest volume of the day rally it towards high of day, test high of day on very low volume.
What does that tell us? It tells us that the bulls don't have a ton of buying orders.
They don't have a ton of people waiting to buy at the current price.
Maybe they don't like buying at the current price, maybe they just don't exist today.
We don't know. But there's just not a ton of buyers pushing the price up.
This move is not very legitimate. And then what do we see?
The bears come in, it makes high of day, and they reject it with higher volume, the highest volume since that news candle.
I took a short on this next green candle when we popped up right towards the top of these candle bodies.
It was an A+ VPA setup. If you take a couple things from this, I want it to be the low-volume rally here, which shows us that bulls don't have a ton, they don't have a ton of power, it's not a very legitimate move, and then the high of day rejection with aggressive volume.
That was kind of the confirmation that I needed to take a short.
This is an A++++ times a thousand setup.
This is a fantastic volume price analysis setup.
If you need to, rewind this thing, watch it again. It was perfect.
The thing moved from, where is this? I think I got in somewhere around 553.40s, uh, and then I ended up selling my puts for, I don't know, 40%, 50%, something like that.
And this thing ran all the way down to 547.
So 553 to 547s, crazy move, and you could have seen it all technically by looking at it from a VPA perspective.
Thank you for watching, guys. I hope you have a fantastic weekend.
And yeah, hit me up in the DMs or replies if you got any questions.
End of transcript · 522 words
 7:01 Understanding Liquidity in Trading
 3:04 Economic Growth Debate in India
 1:59 Office Meeting and Financial Updates
 1:37 New Employee Parth Asks for an Intern During a Meeting
 2:59 Russian Industry: Civilian Sectors Decline as Defense Production Grows
 1:05 Local shopkeeper describes two months of slow business
 1:17 Doña Rosa and Doña Lucha Compete Over Fried Potato Prices
 0:15 Halal Meat Prices and Concerns About Trust
 2:51 Marta Accepts Brossard Spain Leadership After Gabriel Disappears
 1:25 Banks Halt Construction Firm's Foreign Trade Accounts Amid Sanctions
 1:00 Major Financiers Linked to Illegal Pork Imports into Thailand
 0:28 Russia’s GDP Growth, Unemployment, Inflation and Public Debt
 iPhone app Translate videos on your iPhone Paste a TikTok, Instagram or X link, add subtitles in your language and save the video to Photos.

TranslateMom transcribes and translates videos from X, TikTok, YouTube and Instagram. Paste a link and you get a page like this one, in your language.